
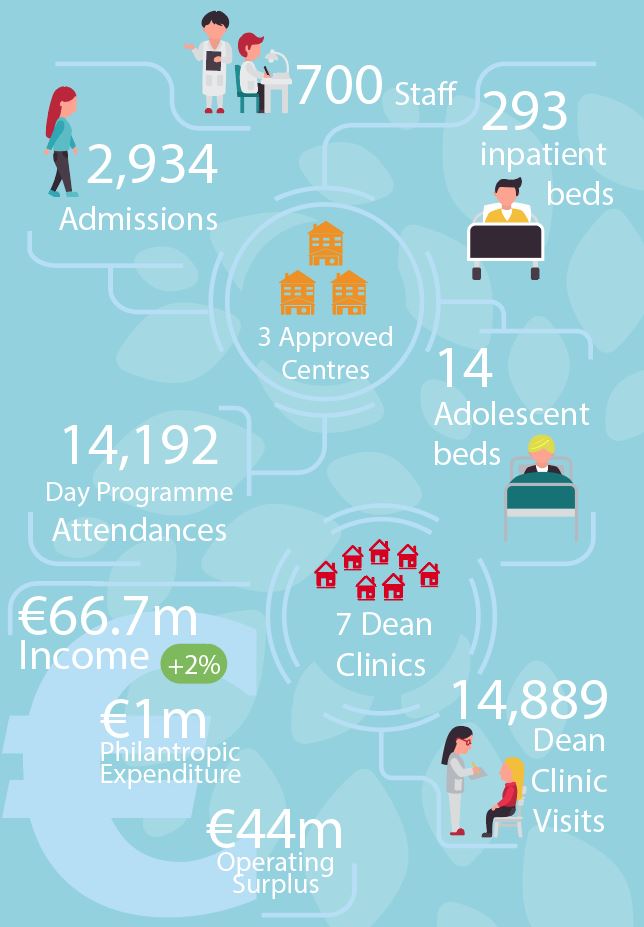
2017 in numbers
Income & Expenditure Account
|
2017 |
2016 |
|
Income - continuing operations |
||
| Maintenance and treatment fees | 66,769 | 65,168 |
| Other income | 369 | 483 |
| 67,138 | 65,651 | |
Expenditure |
||
| Salaries and wages | (51,589) | (50,423) |
| Establishment and administration expenses | (10,629) | (8,637) |
| Other operating costs | (2,865) | (2,832) |
| Depreciation | (2,011) | (1,887) |
| (67,094) | (63,779) | |
Operating surplus |
44 | 1,872 |
| Interest receivable and similar charges | - | 17 |
| Interest payable and similar charges | (111) | (39) |
| Pension income/(expense) | 439 | (324) |
Surplus for the year |
372 | 1,526 |
Statement of Comprehensive Income
|
2017 |
2016 |
|
| Surplus for the year | 372 | 1,526 |
| Remeasurement of net defined benefit pension liability | 5,578 | (5,252) |
Total comprehensive income/ (expense) for the year |
5,950 | (3,726) |
Balance Sheet
|
2017 |
2016 |
|
| Fixed assets | 31,942 | 28,123 |
| Financial assets | 4 | 4 |
| 31,946 | 28,127 | |
Current assets |
||
| Stocks | 73 | 63 |
| Debtors | 13,619 | 12,162 |
| Cash at bank and on hand | 7,408 | 12,035 |
| 21,100 | 24,260 | |
Creditors: |
||
| amounts falling due within one year | (14,055) | (12.074) |
| Net current assets | 7,045 | 12,186 |
| Total assets less current liabilities | 38,991 | 40,313 |
Creditors: |
||
| amounts falling due after more than one year | (7,473) | (1,155) |
| Net assets excluding pension liability | 31,518 | 39,158 |
| Net pension liability | - | (13,590) |
| Net assets | 31,518 | 25,568 |
Capital and special funds |
||
| Capital account | 31,518 | 25,568 |
Statement of changes in equity
|
Capital account |
Total |
|
| Balance at 1 January 2016 | 29,294 | 29,294 |
Total Comprehensive income for the year |
||
| Surplus for the year | 1,526 | 1,526 |
| Other comprehensive expense | (5,252) | (5,252) |
| Total comprehensive expense for the year | (3,726) | (3,726) |
Balance at 31 December 2016 |
25,568 | 25,568 |
|
Capital account |
Total |
|
| Balance at 1 January 2017 | 25,568 | 25,568 |
Total Comprehensive income for the year |
||
| Surplus for the year | 372 | 372 |
| Other comprehensive expense | (5,578) | (5,578) |
| Total comprehensive expense for the year | (5,950) | (5,950) |
Balance at 31 December 2017 |
31,518 | 31,518 |
Cash Flow Statement
Cash flows from operating activities |
||
| Surplus for the year | 372 | 1,526 |
| Adjustments for: | ||
| Depreciation, amortisation and impairment | 2,011 | 1,887 |
| Interest receivable and similar income | - | (17) |
| Interest payable and similar charges | 111 | 39 |
| Pension finance charge | (439) | 324 |
| ________ | ________ | |
| 2,055 | 3,759 | |
| ________ | ________ | |
| (Increase)/decrease in trade and other debtors | (1,457) | 1,129 |
| Decrease in stocks | (10) | 8 |
| Increase in trade and other creditors | 1,866 | 1,519 |
| Decrease in provisions and employee benefits | (7,444) | (1,022) |
| -7,045 | 5,393 | |
| Net cash from operating activities | -4,990 | 5,393 |
| Cash flows from investing activities | ||
| Interest paid | -111 | -39 |
| Acquisition of tangible fixed assets | -5,830 | -3,731 |
| ________ | ________ | |
| Net cash from investing activities | (5,941) | (3,770) |
| ________ | ________ | |
| Cash flows from financing activities | ||
| Repayment of borrowings | 6,304 | (640) |
| Interest received | - | 17 |
| ________ | ________ | |
Net cash from financing activities |
6,304 | -623 |
| ________ | ________ | |
| Net increase in cash and cash equivalents | (4,627) | 1,000 |
| Cash and cash equivalents at 1 January | 12,035 | 11,035 |
| ________ | ________ | |
| Cash and cash equivalents at 31 December | 7,408 | 12,035 |